Messy Math and Emojis: Customer Satisfaction Rates Explained
We all know that TRANSCOM is using new calculations to measure our performance for military shipments, but they haven’t really taken the time to explain what this new math really looks like. We think those of us who will win or lose jobs based on these metrics deserve to know what’s under the hood. It takes us a bit to break down the mathematical mess, but we think it’s worth the time to read.
BREAKING IT ALL DOWN:
In both the current DP3 program and the new GHC program, customers are asked to rate their overall satisfaction with the moving process, and metrics are taken for on-time pickups and deliveries.
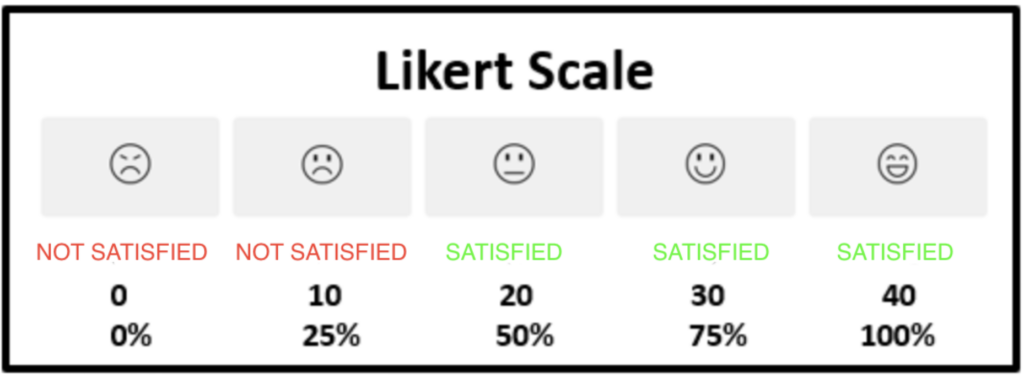
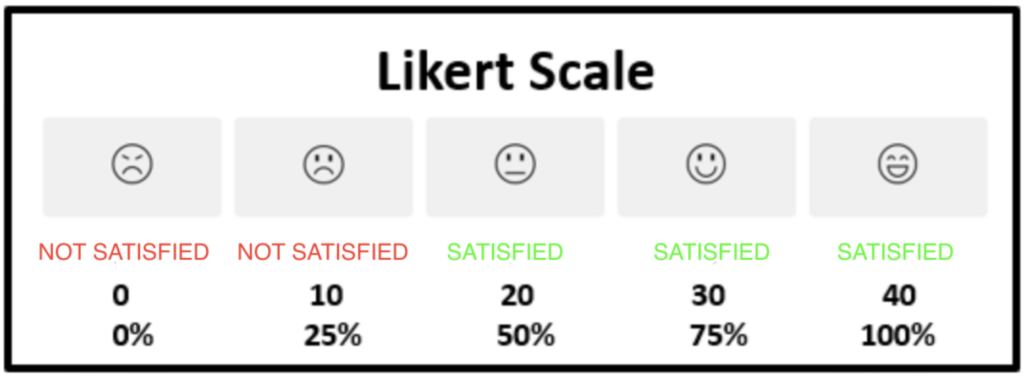
As we know, TRANSCOM now asks customers to rate their moves based on 5 emojis. A very happy smiling face earns the move 40 out of 40 possible points for this question. A very unhappy face earns zero points.
Under the GHC, the top three responses are considered ‘satisfactory.’ The contractor is required to earn a 3 (no smiling/not frowning face) or better response on 91% of shipments in year one, 93% in year two, and eventually 95% in years three through eight.
Using this logic, TRANSCOM is not striving for over 90% customer satisfaction – which is about where our industry is today – they are merely striving for more than 90% of customers to have at least the lowest level of “satisfaction,” or a “not smiling/not frowning face” moving experience. Really going above and beyond for our military families here folks…
But wait, there’s more! Our industry recently learned that TRANSCOM has changed the way they calculate overall satisfaction. Instead of measuring the percentage of customers that report being satisfied or better, they are instead measuring TSPs based on the percentage of total points earned for the Overall Satisfaction question. This is where it gets misleading – using this methodology, TRANSCOM reports that the industry is earning 83% of the total overall satisfaction points.
It’s worth noting one more time how misleading this calculation is. Under the GHC, TRANSCOM’s new math suggests 47.25% customer satisfaction is acceptable Performance Work Statement (PWS) requirements for customer satisfaction! We’ll show you how.
Here’s an example of where the math takes us:
-
- Say there are 300,000 shipments one year, and TRANSCOM receives the typical 20% survey response rate. This equals 60,000 surveys.
- The contract requires 91% of respondents (54,600 out of 60,000 surveys) to be satisfied (not smiling/not frowning face) or higher. 54,600 surveys multiplied by 20 points = 1,080,000 points
- The other 9% can be the lower two responses which earn zero or 10 points. We’ll give them the benefit of the doubt and say they earn 10 points on all the remaining surveys. This brings us to 5,400 surveys multiplied by 10 points = 54,000 points
- 1,134,000 points out of a possible 2,400,000 points is 47.25% of all possible points.
Therefore, the GHC contractor can meet the contract requirement with a “satisfaction” score of 47.25% as it is measured in the DP3 program.
TRANSCOM states that the current program has an 83% ‘rate’, which they characterize as “not good.” However, it’s 76% higher than what would be acceptable in the GHC program!
The point of this exercise is simply to show that TRANSCOM is using a poor metric to describe overall customer satisfaction.
Right now, carriers compete against each other and win more business based on higher satisfaction and performance scores. But the GHC only requires contractors to get the ‘middle’ score, and achieving higher scores will only add cost to the contractor, but not revenue. Something doesn’t add up.
WHAT DOES THIS MEAN FOR THE FUTURE?
The GHC contractor has told the moving industry that they will use the customer satisfaction survey to rate the performance of moving companies. As part of that assessment, if the customer does not reply to the survey, that they will assume that the customer was satisfied – and we don’t necessarily disagree with that approach because it takes into consideration that the person most likely to take the time to do a survey is someone who had a bad move. We just hope that TRANSCOM doesn’t expand this practice to inflate the success of the new program…we’ve just shown evidence of how data is being manipulated so this isn’t a stretch.
Now let’s have some fun with TRANSCOM’s formula – Using their logic, we could say that the 80% of customers who never filled out a survey in DP3 are satisfied. We can then add that of the 20% who did a survey, we know that 90% of them are satisfied (thanks to TRANSCOM’s recently removed dashboard). When you add those two together you get an eye-popping 98% customer satisfaction rate under the current system!
Movers for America has hired an independent, third-party agency to gather facts and compile information that is shared with users who access this website. Movers for America, this website, or the information contained on this website is intended to provide general, factual information and is not produced with the intent to directly or indirectly influence any decisions or behaviors of those who access the website or information. The facts and information contained on this website are made available for website users’ independent use, interpretation, and verification.